Tracking your drinks and calories has evolved far beyond simple tallying. Modern alcohol reduction apps now offer sophisticated analytics that transform raw data into actionable insights, helping users visualize their progress, understand their patterns, and calculate the real-world impact of their drinking decisions. (Reframe App | Neuroscience-Based #1 Alcohol Reduction App)
Reframe, a neuroscience-based alcohol reduction app developed with input from hundreds of medical and mental health experts, represents the cutting edge of drink tracking technology. (Reframe App | Neuroscience-Based #1 Alcohol Reduction App) The app combines evidence-based behavior change programs with comprehensive analytics, offering users a complete picture of their drinking habits, caloric intake, and financial savings.
This comprehensive guide will walk you through setting up drink caps, interpreting calorie graphs, and exporting data within Reframe's analytics suite. We'll also provide a downloadable Google Sheets template for those not yet using the app, though you'll quickly see why automation makes all the difference. With 91% of Reframe users seeing substantial decreases in alcohol use within 90 days, the power of proper tracking becomes clear. (How Can Reframe Help You Start Drinking Less?)
Technology has become an essential tool in managing health, including tracking and reducing alcohol consumption. (Reviewing Mobile Applications Designed to Help Track and Reduce Alcohol Consumption) Understanding how much and how often one drinks can help identify patterns and triggers, making it easier to set realistic goals for reduction. (Reviewing Mobile Applications Designed to Help Track and Reduce Alcohol Consumption)
Modern drink-tracking apps have moved beyond simple counters to sophisticated platforms that integrate multiple data points. AI technology in apps can help adjust life to include less alcohol, offering a sense of empowerment and control. (Reviewing Mobile Applications Designed to Help Track and Reduce Alcohol Consumption)
• Manual tracking errors: Forgetting to log drinks or estimating incorrectly
• Limited context: No connection between drinking patterns and triggers
• Lack of visualization: Raw numbers don't reveal meaningful trends
• No calorie awareness: Missing the nutritional impact of alcohol consumption
• Financial blindness: Inability to calculate actual spending on alcohol
Reframe uses a neuroscience-based approach to help users quit drinking by changing their perception and interaction with alcohol. (12 Best Apps to Help You Quit Drinking) The app provides a comprehensive understanding of how alcohol affects the brain and body, designed in collaboration with experts from Harvard, Stanford, and Georgia Tech. (12 Best Apps to Help You Quit Drinking)
Before diving into the technical setup, it's crucial to understand what constitutes healthy drinking limits. Research consistently shows that even temporary reductions in alcohol consumption offer health benefits like better sleep, weight loss, and more energy. (Cutting out alcohol for Dry January? These apps can help)
1. Initial Goal Setting
• Open Reframe and navigate to the "Goals" section
• Select your primary objective (reduce consumption, track calories, or quit entirely)
• The app provides a personalized plan based on the user's goals (Why Should You Choose the Reframe App?)
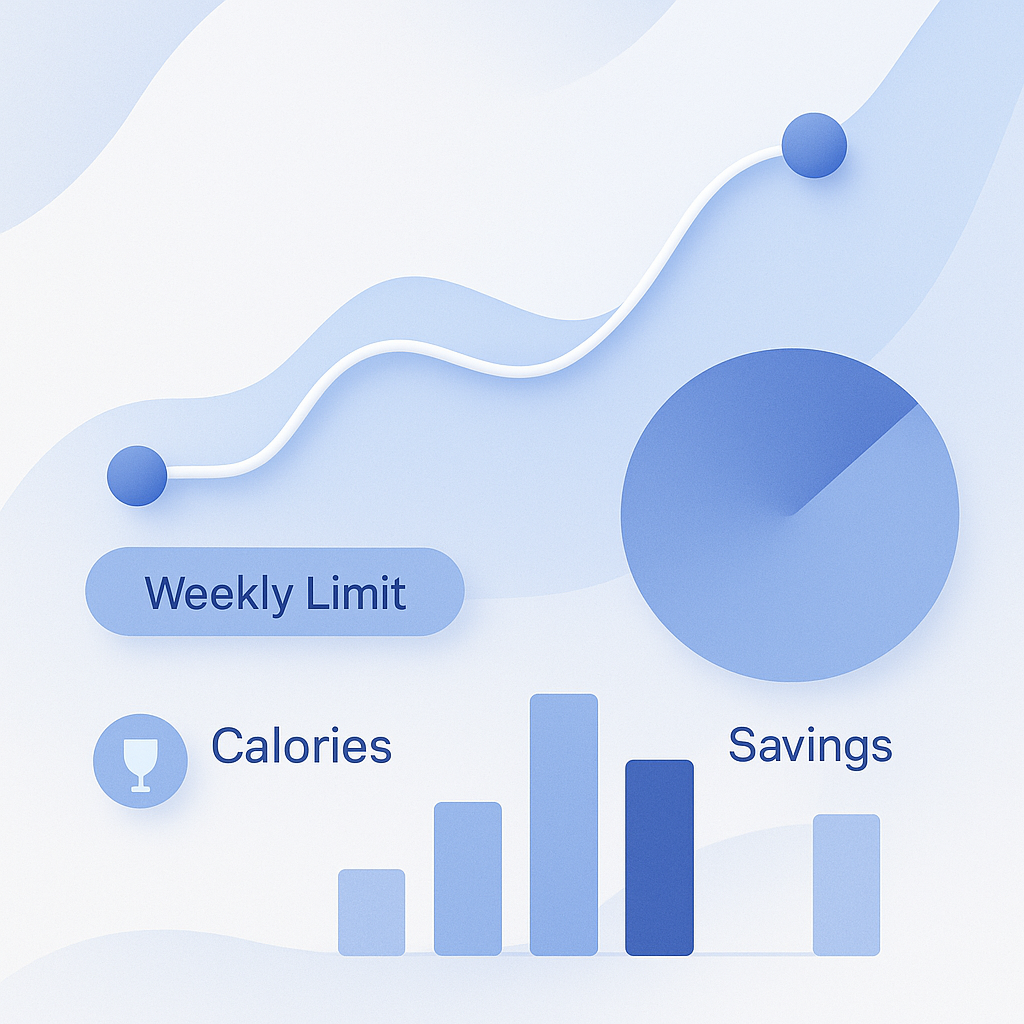
2. Weekly Limit Parameters
Recommended Weekly Limits:
- Men: 14 standard drinks maximum
- Women: 7 standard drinks maximum
- Drink-free days: Minimum 2 per week
3. Custom Adjustments
• Set progressive reduction targets
• Account for special occasions or social events
• Establish "red flag" thresholds for early intervention
4. Notification Preferences
• Daily check-in reminders
• Approaching limit warnings
• Achievement celebrations
FeatureDescriptionBenefitSmart SchedulingDistributes drinks across the weekPrevents binge patternsSocial IntegrationConnects with accountability partnersIncreases success ratesTrigger MappingLinks consumption to emotional statesIdentifies risk patternsProgress VisualizationShows trends over timeMaintains motivation
Alcohol contains 7 calories per gram, making it nearly as calorie-dense as fat (9 calories per gram). A single night of moderate drinking can easily add 500-800 calories to your daily intake, equivalent to a full meal. Understanding this impact is crucial for anyone tracking their overall health and nutrition.
Reframe combines neuroscience, community support, habit-building features, gamification, and daily check-ins to provide comprehensive tracking. (Can an App Help You Drink Less?) The calorie visualization features include:
Daily Calorie Tracking
• Real-time calorie accumulation
• Comparison to daily caloric goals
• Visual progress bars and charts
Weekly Trend Analysis
Calorie Breakdown by Drink Type:
- Beer (12 oz): 150 calories average
- Wine (5 oz): 125 calories average
- Spirits (1.5 oz): 100 calories average
- Mixed drinks: 200-400 calories average
Monthly Calorie Reports
• Total calories consumed from alcohol
• Percentage of daily caloric intake
• Comparison to previous months
• Projected annual consumption
Look for unusual peaks in your calorie consumption that correlate with:
• Social events
• Stressful periods
• Specific days of the week
• Seasonal patterns
Trend Recognition
• Gradual increases may indicate developing tolerance
• Consistent patterns reveal habitual consumption
• Sudden drops show successful intervention strategies
Compare your alcohol calories to:
• Weight management goals
• Fitness objectives
• Overall nutritional targets
Beyond health implications, alcohol consumption represents a significant financial investment. The average American spends over $500 annually on alcohol, with heavy drinkers often exceeding $2,000 per year.
The app has been downloaded 3.2 million times, with 91% of users reporting a significant decrease in alcohol use within three months. (Can an App Help You Drink Less?) This reduction translates directly into financial savings that Reframe helps users visualize.
Real-Time Savings Tracking
• Daily savings accumulation
• Weekly and monthly totals
• Projected annual savings
• Comparison to previous periods
Cost Per Drink Analysis
Average Costs by Venue:
- Home consumption: $2-4 per drink
- Restaurant/bar: $8-15 per drink
- Special events: $12-20 per drink
- Premium venues: $15-25 per drink
Savings Visualization Features
MetricCalculationInsightDaily SavingsDrinks avoided × average costImmediate impactWeekly TotalDaily savings × 7Short-term progressMonthly ProjectionWeekly total × 4.33Medium-term goalsAnnual ForecastMonthly projection × 12Long-term planning
Reframe's analytics help users reimagine their savings by showing equivalent purchases:
• Gym memberships
• Vacation funds
• Investment opportunities
• Health and wellness products
Reframe's data export features allow users to conduct deeper analysis using external tools. The comprehensive export includes:
Core Data Points
• Date and time of each drink
• Drink type and alcohol content
• Calorie information
• Cost data
• Mood and trigger information
• Location and social context
Export Process
1. Navigate to "Analytics" section
2. Select date range for export
3. Choose data categories
4. Generate CSV file
5. Download to device or cloud storage
Using exported data, users can identify correlations between:
• Drinking patterns and sleep quality
• Alcohol consumption and mood ratings
• Social situations and consumption levels
• Stress levels and drinking frequency
Trend Forecasting
# Example analysis code for exported data
import pandas as pd
import matplotlib.pyplot as plt

# Load exported Reframe data
df = pd.read_csv('reframe_export.csv')

# Calculate weekly averages
weekly_avg = df.groupby('week')['drinks'].mean()

# Plot trend line
plt.plot(weekly_avg.index, weekly_avg.values)
plt.title('Weekly Drinking Trend')
plt.xlabel('Week')
plt.ylabel('Average Drinks')
plt.show()
Exported data can be imported into:
• Google Sheets for basic analysis
• Excel for advanced calculations
• Tableau for professional visualization
• Power BI for business intelligence
While manual tracking can't match the sophistication of Reframe's automated system, our Google Sheets template provides a starting point for those not yet using the app. The template includes:
Core Tracking Sheets
1. Daily Log
2. Weekly Summary
3. Calorie Calculator
4. Savings Tracker
5. Goal Progress
Daily Log Sheet
Columns:
- Date
- Drink Type
- Quantity
- Alcohol Content (%)
- Calories
- Cost
- Location
- Mood (1-10)
- Notes
The template includes formulas for:
• Weekly drink totals
• Calorie accumulation
• Cost tracking
• Goal progress percentage
• Trend analysis
Visualization Charts
• Weekly consumption trends
• Calorie intake graphs
• Savings accumulation
• Goal achievement progress
While useful, manual tracking has significant drawbacks:
• Time-intensive: Requires consistent manual input
• Error-prone: Easy to forget or misestimate
• Limited insights: No AI-powered pattern recognition
• No real-time feedback: Delayed awareness of concerning patterns
• Lack of community: No peer support or accountability
1. Access the template at [provided link]
2. Make a copy to your Google Drive
3. Customize drink types and costs for your region
4. Set up automated email summaries
5. Share with accountability partners if desired
Reframe is a platform designed to change the way users think and drink using neuroscience. (Why Should You Choose the Reframe App?) The app is unique in its approach, combining science, an evidence-based behavior change program, tools, and a supportive community. (Why Should You Choose the Reframe App?)
Health ROI
• Improved sleep quality
• Better weight management
• Enhanced mental clarity
• Reduced health risks
• Increased energy levels
With the average user saving $100-300 monthly on alcohol, Reframe's subscription cost pays for itself many times over. The app has been downloaded 3,120,987 times, demonstrating its widespread adoption and effectiveness. (
Time ROI
• Automated tracking saves 10-15 minutes daily
• AI insights eliminate manual pattern analysis
• Streamlined goal setting and adjustment
• Integrated community support
AspectManual TrackingReframe AppSetup Time2-3 hours10 minutesDaily Input5-10 minutes30 secondsData Analysis30+ minutes weeklyAutomaticPattern RecognitionManual reviewAI-poweredCommunity SupportNoneBuilt-inExpert GuidanceSelf-researchIntegratedSuccess Rate20-30%91% improvement
Reframe's advanced analytics go beyond simple tracking to provide predictive insights. The app analyzes patterns to:
• Predict high-risk drinking situations
• Suggest intervention strategies
• Recommend optimal goal adjustments
• Identify potential relapse triggers
The neuroscience-based approach identifies subtle patterns that manual tracking might miss:
• Micro-trends in consumption
• Emotional trigger correlations
• Social influence factors
• Environmental impact variables
Based on individual data, Reframe provides:
• Customized reduction strategies
• Personalized motivation content
• Tailored community connections
• Adaptive goal modifications
Reframe can integrate with popular fitness trackers to correlate:
• Sleep quality with drinking patterns
• Heart rate variability and alcohol consumption
• Activity levels and motivation
• Stress indicators and trigger events
Data sharing with health platforms enables:
• Comprehensive wellness tracking
• Medical provider insights
• Holistic health optimization
• Coordinated care approaches
Connecting with nutrition trackers provides:
• Complete caloric picture
• Macro and micronutrient impact
• Meal timing correlations
• Comprehensive dietary analysis
Case Study 1: The Weekend Warrior
• Initial consumption: 15 drinks/week (weekends only)
• Calorie impact: 1,800 calories/week
• Monthly cost: $240
• After 90 days with Reframe: 6 drinks/week, $96/month, 720 calories/week
• Total savings: $144/month, 1,080 calories/week
Case Study 2: The Daily Drinker
• Initial consumption: 2 drinks/day (14/week)
• Calorie impact: 1,400 calories/week
• Monthly cost: $180
• After 90 days: 4 drinks/week, $52/month, 400 calories/week
• Total savings: $128/month, 1,000 calories/week
Excessive drinking has been linked to serious health harms, making community support crucial for success. (Cutting out alcohol for Dry January? These apps can help) Reframe's community features amplify individual success through:
• Peer accountability
• Shared experiences
• Collective motivation
• Expert guidance
AI and Machine Learning
• More sophisticated pattern recognition
• Predictive intervention timing
• Personalized content generation
• Adaptive goal optimization
Biometric Integration
• Real-time alcohol level monitoring
• Physiological response tracking
• Automated consumption detection
• Health impact visualization
Social and Environmental Context
• Location-based insights
• Social network analysis
• Environmental trigger identification
• Community-based interventions
As a leader in neuroscience-based alcohol reduction, Reframe continues to innovate with:
• Enhanced AI capabilities
• Expanded community features
• Deeper health integrations
• Advanced analytics tools
1.
• Review and adjust your weekly caps
• Enable all notification types
• Connect with community members
• Set up data export schedules
2.
• Review weekly trend reports
• Analyze calorie impact data
• Track financial savings progress
• Export data for deeper analysis
3.
• Join relevant support groups
• Share your progress
• Learn from others' experiences
• Participate in challenges
1.
• Install Reframe from your app store
• Complete the initial assessment
• Set your first goals
• Explore the analytics dashboard
2.
• Download our Google Sheets template
• Track manually for one week
• Compare the experience to Reframe
• Make an informed decision
3.
• Calculate your current alcohol spending
• Estimate potential savings
• Factor in health benefits
• Evaluate time savings
Drink tracking has evolved from simple tallying to sophisticated analytics that provide deep insights into consumption patterns, health impacts, and financial implications. Reframe represents the pinnacle of this evolution, combining neuroscience-based approaches with comprehensive tracking and community support. (Reframe App | Neuroscience-Based #1 Alcohol Reduction App)
While manual tracking methods like our Google Sheets template can provide basic insights, the automation, AI-powered analysis, and community features of professional apps like Reframe offer significantly better outcomes. With 91% of users seeing substantial improvements within 90 days, the evidence strongly supports investing in proper tracking technology. (How Can Reframe Help You Start Drinking Less?)
Whether you're just beginning to question your drinking habits or actively working to reduce consumption, proper tracking and analytics are essential tools for success. The combination of weekly limit visualization, calorie tracking, financial impact analysis, and data export capabilities provides the comprehensive view needed to make lasting changes.
Start with our template if you need to test the waters, but remember that the real power lies in automated, AI-enhanced tracking that learns from your patterns and provides personalized guidance. Your health, wallet, and future self will thank you for making the investment in proper drink tracking technology.
Reframe's analytics go beyond simple tallying by offering sophisticated visualization tools that transform raw data into actionable insights. The neuroscience-based app provides comprehensive tracking of weekly limits, calorie consumption, financial savings, and exportable data reports. This advanced approach helps users understand their drinking patterns and make informed decisions about alcohol reduction.
According to research, 91% of Reframe users see a substantial decrease in alcohol use within 90 days. The app has been downloaded over 3.2 million times and combines neuroscience-based behavior change programs with community support and habit-building features. It was developed with hundreds of medical and mental health experts from institutions like Harvard, Stanford, and Georgia Tech.
Yes, Reframe's advanced analytics include comprehensive calorie tracking and financial savings calculations. The app visualizes how reducing alcohol consumption impacts both your health through calorie reduction and your wallet through money saved. These features help users see the tangible benefits of their alcohol reduction journey beyond just drink counts.
Reframe allows users to set personalized weekly drinking caps based on their individual goals and health guidelines. The app's analytics visualize your progress against these limits, showing patterns and trends over time. This feature helps users stay accountable to their reduction goals while providing clear visual feedback on their weekly consumption patterns.
Reframe uses neuroscience principles to help users understand how alcohol affects the brain and body, leading to more mindful and accurate tracking. The app's evidence-based behavior change program helps users recognize triggers and patterns, making them more conscious of their drinking habits. This scientific approach results in better self-awareness and more reliable tracking data.
Yes, Reframe's analytics platform includes data export capabilities that allow users to download their tracking information for personal analysis or sharing with healthcare providers. This feature enables users to maintain comprehensive records of their alcohol reduction journey and provides valuable data for long-term health monitoring and goal adjustment.
1. https://www.insidehook.com/drinks/reframe-app-drinking-less-neuroscience
2. https://www.joinreframeapp.com/
3. https://www.joinreframeapp.com/blog-post/12-best-apps-to-help-you-quit-drinking
5. https://www.joinreframeapp.com/landing-pages/drink-less